
The Gainmaker lens
Contribution Thinking
Know what drives value. Focus where it counts.
This isn’t a dashboarding exercise. It’s a contribution model — built from the ground up with process insight, industrial engineering and lean thinking — that shows your leadership team exactly what moves the business.
Section 1
Three Forces, One Model
What creates value, what supports it, what leaks it
Every business has a handful of outcomes that matter more than the rest. We call them Gainmakers — the single most important performance metric for each core process, tied directly to business value.
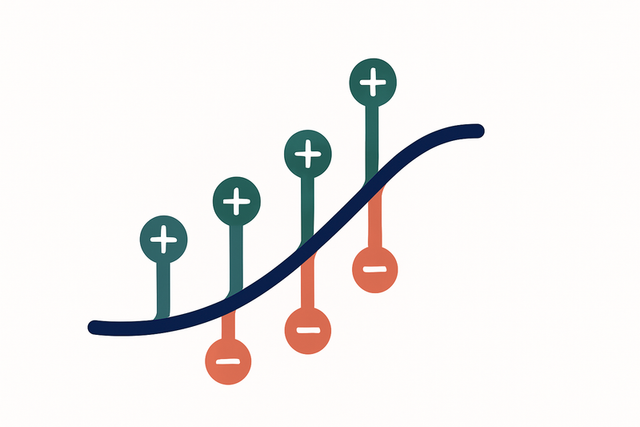
Every Gainmaker is shaped by two forces. Value contributors are the processes, behaviours and decisions that push it forward. Detractors are the friction, waste and blind spots dragging it back.
Each contributor and detractor is classified as controllable or uncontrollable, so your teams know exactly where effort will pay off.
An Example
One Gainmaker, mapped
- Line loss rate
- Factory rejection rate
- Allocation conflicts between partners
- Transport delays
- Yield per production line
- Seeding density
- Grow-cycle completion rate
- Weather harvest windows (uncontrollable)
- Total activated harvest
- Current 847 t/month
- Target 1,200 t/month
- Gap to close: 29%
An illustrative model from an aquaculture business. Sensitivity analysis then asks: if each controllable factor improved by 10%, which would move the Gainmaker most?
Section 2
What Clients Receive
Tangible outputs, tailored to your business
A Structured Contribution Model
A documented, visual map of your key metrics, grouped by Gainmaker and classified by influence, severity and controllability.
Live Power BI Dashboards
Real-time insight into Gainmakers, contributors and detractors, with trend and sensitivity analysis where the data allows.
A Strategic Project and Opportunity List
The high-impact improvements we find along the way, each backed by a business case and a clear priority.
Optional Implementation Support
Hands-on delivery, oversight and performance assurance, for clients who want us to see the work through.
Section 3
How We Build It
We don’t guess — we map the business and build from the ground up
Discover
Understand the context, operating model and leadership objectives.
What happens
Targeted interviews and work sessions with leadership and the people doing the work.
Outputs
- Business context
- Leadership objectives
Who’s involved
Leadership team, process owners
Map
Map core processes, outputs and pain points across functions.
What happens
Industrial engineering methods — observation, process mapping, value stream analysis.
Outputs
- Process maps
- Pain point register
Who’s involved
Process owners, frontline teams
Classify
Define the Gainmaker for each process and classify every factor.
What happens
We identify the relevant metrics and classify each contributor and detractor by severity and controllability.
Outputs
- Gainmaker per process
- Contributor and detractor list
Who’s involved
Leadership, Finance
Construct
Build the hierarchy of how metrics influence outcomes.
What happens
The full model, and the logic that links data to value.
Outputs
- The Contribution Model
- Data requirements
Who’s involved
Gainmaker team
Visualise
Wire the model into live dashboards.
What happens
Where data exists, we integrate it. Where it doesn’t, we build the capture through Gainflow.
Outputs
- Power BI dashboards
- Data gaps closed
Who’s involved
IT, data owners
Validate
Test the model against actual performance.
What happens
We check the model against results and frontline feedback, so it’s not just correct, but useful.
Outputs
- A validated model
- Prioritised opportunity list
Who’s involved
Leadership, frontline teams
Ready to Find Your Gainmakers?
A first conversation takes 30 minutes. We’ll ask how your business runs today, and you’ll leave knowing where we’d look first.